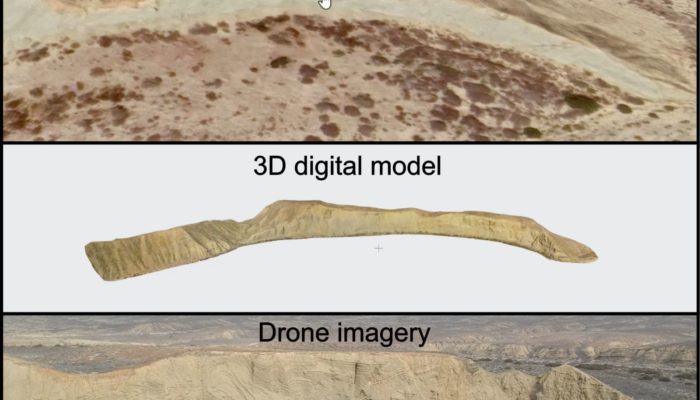
The digitization of sedimentary outcrops

From Sketches to Early Photographs
The knowledge of geology, particularly sedimentology, has been successfully transferred and shared for hundreds of years through sketches. Just like a botanist or a zoologist, a geologist can record field data using only paper and pencil in the form of drawings (see one of the oldest published geological sketches in Figure 1). Geological maps and sketches of outcrops are the two basic elements of field data for a geologist. For a sedimentologist, a primary goal may be to show the spatial distribution and geometry of sedimentary ‘units’ (i.e., bed, member, formation, group, and supergroup).

Figure 1. This sketch is considered one of the oldest published geological sketches. Georgious Agricola intended to show a mineral deposit in the form of a vein in a mountain. From “De re metallica” (1556), Page 45.

The advent of photography could be considered a first breakthrough in the collection and sharing of outcrop data (Figure 2 shows one of the oldest photographs taken for geological purposes). Any drawing is an artistic representation of ‘reality,’ while a photograph is an almost perfect 2D representation of it. The more realistic the representation, the better anyone can observe the qualitative and quantitative characteristics of an outcrop. In summary, ideally, outcrop data should be shared exactly as if one were physically there to measure and observe the characteristics of the sedimentary rock. However, there are issues that prevent an outcrop from being represented in such a way; for example, the wide range of scales of all features, the potentially infinite amount of data that can be recorded, or the fact that some data are qualitative (e.g., color, texture determined in the field), so the instrument used to record images of the outcrop could offer a significantly different image from what our eyes and brain process. Let’s move on to recent technological innovations that have made it possible to record outcrop data across a broader range of scales and features.

Figure 2. Image from page 128 of the «Bulletin of the Geological Society of America» (1890). Title: Bulletin of the Geological Society of America. Year: 1890.

Aerial Images: Airplanes and Satellites
Soon, the military realized the benefit of taking photographs of any territory from the air: the perspective and scale of viewing would provide information about enemy positions and the routes of ground vehicles. Geologists also immediately recognized the value of aerial photography for mapping. U.S. geologists pioneered this in the late 1920s[1], using aerial photographs to differentiate soil types and lithology based on shadows in black-and-white photographs. However, the real breakthrough was the deployment of satellites, which incorporate high-resolution lenses and a wide range of sensors. The major leap forward was the multispectral satellite image, which allowed for high-precision predictive mapping of large territories around the Earth. In 1972, NASA launched the first multispectral satellite with the Landsat Mission. Multispectral sensors measure electromagnetic signals in specific ranges of the solar light spectrum, making it possible to identify a variety of minerals. By 2022, the WorldView-3 satellite is at the forefront of satellite imaging. This satellite uses 16 bands positioned in the near-infrared and shortwave windows, allowing for the identification of a wider and more accurate range of minerals, as well as a spatial resolution of 1.25 to 3.7 meters for mineral analysis (Figure 3). Satellites help map geologic features on a relatively large spatial scale and identify general lithologies over broad regions, but what about the collection of outcrop data on a smaller spatial scale?

The Arrival of Drones: Democratizing Outcrop Data Collection

Today, it is no longer necessary to pay hundreds of euros to rent a private plane or helicopter to take photos from the air. We can buy a drone for a few hundred euros and collect photos for years (unless you crash it!). The availability of relatively inexpensive drones with good optics (i.e., camera lens) allows any geologist to collect images from any distance and angle of a given outcrop. More importantly, it enables the collection of images of outcrops that were previously inaccessible. Drones have also facilitated the operation of topographic techniques such as LIDAR and photogrammetry[3]. These techniques aim to provide high-resolution topographic models of the terrain and are now easier and cheaper to perform thanks to commercially available drones. In the case of LIDAR, it will require more investment than photogrammetry because a Lidar sensor that will be mounted on the drone must be purchased.

Virtual and Augmented Reality: The Next Advanced Experience?

Current innovations in data storage and management, along with technical advancements in hardware, point toward the development of virtual class or training tools[4]. Can these tools effectively transfer knowledge with the same quality as a live field experience? Definitely not. As an instructor of online and field courses, I have evaluated students and learners first by analyzing outcrop data from 3D models, photos, and videos created with drones, and then taken them to the field at the same outcrop. The result: they consistently show poorer observation of key sedimentary features compared to the live field visit (see an example of this problem here: Outcrop Data Comparison). Poor observation of data will inevitably lead to poorer transfer of knowledge and skills. No photo or 3D model today can match a live visit to an outcrop, but we must not forget that we could not showcase many excellent and inaccessible outcrops to other students and professionals without the help of drones. There are many advancements, but today the best way to learn geology is by combining live visits to outcrops with satellite data, drone data, and other remote sensing techniques.

[1] www.asprs.org/wp-content/uploads/pers/1947journal/dec/1947_dec_557-565.pdf

[2] https://effigis.com/en/new-era-geological-mapping-multispectral-satellites-advanced-data-processing

[3] www.propelleraero.com/blog/drone-surveying-misconceptions-lidar-vs-photogrammetry/#:~
=Lidar%20is%20a%20direct%20measurement,overlap%20and%20sufficient%20ground%20control

[4] www.earthmagazine.org/article/fieldwork-among-pixels-virtual-and-augmented-reality-diversify-geoscience-education/


La digitalización de afloramientos sedimentarios

De bocetos a las primeras fotografías

El conocimiento de la geología y, en particular, de la sedimentología, se ha transferido y compartido con éxito durante cientos de años a través de bocetos. Al igual que un botánico o un zoologista, un geólogo puede registrar datos de campo con solo papel y lápiz en forma de dibujos (ver uno de los bocetos geológicos publicados más antiguos en la Figura 1). Los mapas geológicos y los bocetos de afloramientos son los dos elementos básicos de los datos de campo para un geólogo. Para un sedimentólogo, un objetivo principal puede ser mostrar la distribución espacial y la geometría de las ‘unidades’ sedimentarias (es decir, cama, miembro, formación, grupo y supergrupo).

Figura 1. Este boceto se considera uno de los bocetos geológicos publicados más antiguos. Georgious Agricola pretendía mostrar un depósito mineral en forma de veta en una montaña. De “De re metallica” (1556), Página 45.

La llegada de la fotografía podría considerarse un primer avance en la recolección y el intercambio de datos de los afloramientos (la Figura 2 muestra una de las fotografías más antiguas tomadas con un propósito geológico). Cualquier dibujo es una representación artística de la ‘realidad’, mientras que una fotografía es una representación 2D casi perfecta de ella. Cuanto más realista sea su representación, mejor podrá cualquier persona observar las características cualitativas y cuantitativas de un afloramiento. En resumen, idealmente, los datos de un afloramiento deberían compartirse exactamente como si uno estuviera físicamente allí para poder medir y observar las características de la roca sedimentaria. Pero hay problemas que impiden la representación de un afloramiento de tal manera; por ejemplo, la amplia gama de escalas de todas las características, la cantidad potencialmente infinita de datos que se pueden registrar, o el hecho de que algunos datos son cualitativos (por ejemplo, color, textura determinada en el campo), por lo que el instrumento utilizado para registrar imágenes del afloramiento podría ofrecer una imagen significativamente diferente de lo que nuestros ojos y cerebro procesan. Pasemos a las innovaciones tecnológicas en la historia reciente que han hecho posible registrar datos de afloramientos en una gama más amplia de escalas y características.

Figura 2. Imagen de la página 128 del “Boletín de la Sociedad Geológica de América” (1890). Título: Boletín de la Sociedad Geológica de América. Año: 1890.

Imágenes aéreas: aviones y satélites

Muy pronto, los militares se dieron cuenta del beneficio de tomar fotografías de cualquier territorio desde el aire: La perspectiva y escala de visualización proporcionarían información sobre la posición de los enemigos y las rutas de los vehículos terrestres. Los geólogos también se dieron cuenta de inmediato del valor de la fotografía aérea para la cartografía. Los geólogos de EE. UU. fueron pioneros a finales de los años 20[1], utilizando fotografías aéreas para diferenciar tipos de suelo y litología a partir de sombras en fotografías en blanco y negro. Sin embargo, el verdadero avance fue el despliegue de satélites, que incorporan lentes de alta resolución y una amplia gama de sensores. El gran salto adelante fue la imagen satelital multiespectral, que permitió un mapeo predictivo de alta precisión para grandes territorios alrededor de la Tierra. En 1972, la NASA lanzó el primer satélite multiespectral con la Misión Landsat. Los sensores multiespectrales miden la señal electromagnética en rangos específicos del espectro de luz solar, lo que hace posible la identificación de una variedad de minerales. En 2022, el satélite WorldView-3 está a la vanguardia de la imagen satelital. Este satélite utiliza 16 bandas posicionadas en las ventanas del infrarrojo cercano y de onda corta, lo que permite la identificación de un rango más amplio y preciso de minerales, así como una resolución espacial de 1.25 a 3.7 metros para el análisis mineral (Figura 3). Los satélites ayudan a mapear características geológicas de escala espacial relativamente grande e identificar litologías generales en amplias regiones, pero, ¿qué hay de la recolección de datos de afloramientos en una escala espacial más pequeña?

La llegada de los drones: democratización de la recolección de datos de afloramientos

Hoy en día, no es necesario pagar, al menos, cientos de euros por alquilar un avión privado o un helicóptero para recoger fotos desde el aire. Podemos comprar un dron por unos pocos cientos de euros y recolectar fotos durante años (¡a menos que lo estrelles!). La disponibilidad de drones relativamente baratos con buena óptica (es decir, el objetivo de la cámara) permite a cualquier geólogo recolectar imágenes desde cualquier distancia y ángulo de un afloramiento dado. Más importante aún, permite la recolección de imágenes de afloramientos, que antes eran inaccesibles. Los drones también han facilitado la operación de técnicas de topografía como LIDAR y fotogrametría[3]. Estas técnicas están destinadas a proporcionar modelos topográficos de alta resolución del terreno y, ahora, son más fáciles y baratas de realizar gracias a los drones disponibles en el mercado. En el caso de LIDAR, se necesitará gastar más dinero que en fotogrametría porque es necesario comprar un sensor Lidar que se montará en el dron.

Realidad virtual y aumentada: ¿la próxima experiencia avanzada?

Las innovaciones actuales en almacenamiento y gestión de datos, además de los avances técnicos en hardware, apuntan al desarrollo de herramientas de clase o entrenamiento virtual[4]. ¿Pueden estas herramientas transferir efectivamente conocimiento con la misma calidad en comparación con una experiencia en vivo en el campo? Definitivamente, no. Como instructor de cursos en línea y de campo, he evaluado a estudiantes y aprendices para primero analizar datos de afloramientos a partir de modelos 3D, fotos y videos creados con drones y luego, los he llevado al campo al mismo afloramiento. El resultado: siempre muestran una observación más pobre de características sedimentarias clave en comparación con la visita en vivo al campo (ver un ejemplo de este problema aquí: Comparación de datos de afloramientos). Una observación pobre de los datos conducirá inevitablemente a una transferencia de conocimiento y habilidades más pobre. Ninguna foto o modelo 3D puede hoy igualar una visita en vivo a un afloramiento, pero no debemos olvidar que no podríamos mostrar muchos afloramientos excelentes e inaccesibles a otros estudiantes y profesionales sin la ayuda de drones. Hay muchos avances, pero hoy la mejor manera de aprender geología es combinando visitas en vivo a afloramientos con datos de satélite, dron y otras técnicas de teledetección.

[1] www.asprs.org/wp-content/uploads/pers/1947journal/dec/1947_dec_557-565.pdf

[2] https://effigis.com/en/new-era-geological-mapping-multispectral-satellites-advanced-data-processing

[3] www.propelleraero.com/blog/drone-surveying-misconceptions-lidar-vs-photogrammetry/#:~:text=Lidar%20is%20a%20direct%20measurement,overlap%20and%20sufficient%20ground%20control

[4] www.earthmagazine.org/article/fieldwork-among-pixels-virtual-and-augmented-reality-diversify-geoscience-education/