The area where most of the collapses occurred is an ancient alluvial drain for the drainage of water and sediment from the upper parts of Mount Ahir.
When it comes to earthquakes, the nature of the geology of the Earth’s surface and its geometry are critical for understanding the intensity and type of ground movement where we live. Of course, other factors are important when assessing the risk of damage to human-built structures (for example, engineering design and materials used). From a sedimentological perspective, it is possible to identify critical elements in the subsurface that we must consider if we want to predict areas where human structures will receive comparatively high-intensity seismic waves. Two critical elements are: (1) the general architecture of the subsurface geology, which includes the type of sediment and types of rocks, as well as their dimensions, and (2) the geometry of the Earth’s surface (i.e., topography).
An earthquake can simply be defined as the movement of the ground due to shock waves. There are different causes for shock waves to occur in the Earth (read more here). The earthquakes in southern Turkey in 2023 were triggered by the rupture of two sections associated with the southeastern boundary of the so-called Anatolian tectonic plate. Several areas of the crust at depths of less than 10 km were torn apart, and the shock waves, also called seismic waves, began to propagate in all directions at speeds on the order of kilometers per second. Seismic waves are not just of one type: as the crust pushes rocks and sediments away from the area where it broke, two main waves develop: a first wave, called ‘P’, and a second, slower wave, called ‘S’. When they reach the Earth’s surface, these two fronts interact with it, developing what are called surface waves, which are the most destructive for human structures. The physical characteristics of these surface waves change dramatically as they propagate along the Earth’s surface, depending on the two critical elements mentioned above: the architecture of the subsurface and the topography (read more here).
These changes in the physical characteristics of the waves are generally explained by experts as the ‘non-linear’ behavior of the ground (soil and sediment will be used interchangeably here). In simple terms, the non-linear behavior of a material refers to a situation where a material does not respond to a force or stress predictably, based on what had been occurring as the stress increased. For example, if a relatively small amount of force is applied to an elastic band, it will stretch proportionally to the applied force, and we can record this data as linear behavior. However, when more force is applied, the elastic band will eventually reach a point where it no longer stretches proportionally to the applied force. The same stress has caused changes in the physical properties of the elastic band, so the mathematics that would be used to predict its deformation no longer works. This change in the relationship between applied force and deformation is called non-linear behavior. In other words, a material that exhibits non-linear behavior may behave unexpectedly or unpredictably when subjected to variable levels of stress or force. This can make it difficult to accurately predict which areas in a populated region will experience more damaging ground movement than others.
Due to this uncertainty, geoengineers develop computer and laboratory models to test different scenarios where seismic waves with varying properties propagate through geological models with various types of subsurface architecture and topography (Figure 1).
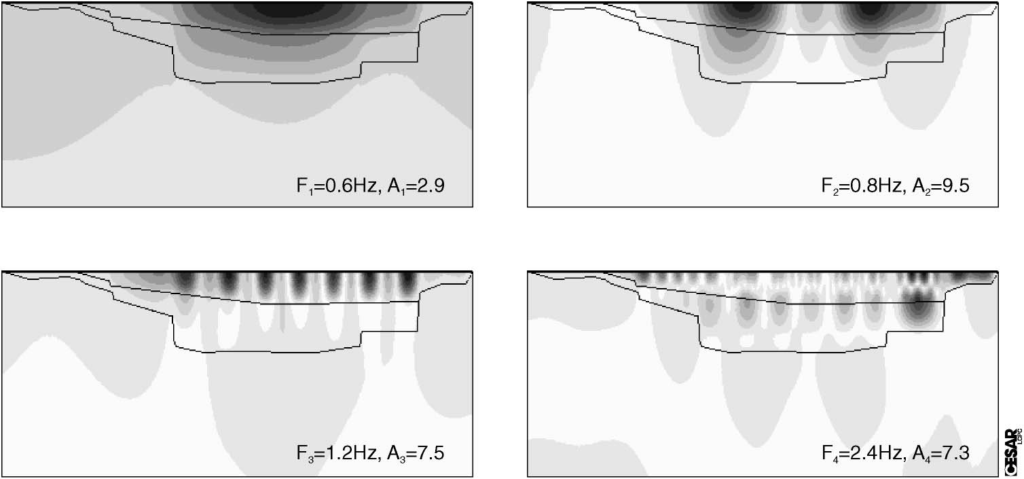
Figure 1 Amplification of seismic waves in the Volvi-EuroSeisTest basin, Greece: BEM simulations at different frequencies Fi and related maximum amplifications (Semblat, 2005, Semblat, 2011).
The illustrated models aim to understand how seismic waves propagate in different configurations of geological structures and thicknesses of sedimentary units to the ‘bedrock surface’ of the basin (the surface of well-lithified rock units where sediments rest). Knowing the depth to bedrock from the ground is of utmost importance for some experts (for example, Semblat et al., 2005). There is a consensus that settlements over ‘soft’ sediment-filled valleys or isolated asymmetric rocky reliefs tend to show more intense surface waves (for example, Primofiore et al., 2020). However, the geological and geomorphological factors related to the sedimentological evolution of the landscape also impact the intensity of surface waves: topography as a key factor that can amplify ground movement during earthquakes (Çelebi, 1991; Primofiore et al., 2020).
Italy and Turkey: When Sedimentology Plays a Key Role in Understanding Areas with Higher Risk of Damage
From August 2016 to January 2017, a seismic sequence occurred in the Central Apennines (Italy). During the first shock, two nearby locations showed intensity values that were different enough to investigate the cause(s): macroseismic surveys reported an EMS intensity of 8-9 in the old village of Arquata del Tronto, located along the rocky ridge, while an intensity of 7 EMS was recorded in the Borgo neighborhood, situated in the alluvial valley at the foot of the rocky ridge (Primofiore et al., 2020). Researchers proposed the hypothesis that differences in topography and subsurface geology could explain the variability in intensity. Numerical models established for different soil movement frequencies would support that hypothesis (Figure 2).

This figure is the result of modeling S waves in the area of the Arquata del Tronto ridge. Each figure shows amplification results for ‘components’ of the wave perpendicular to each other. The red colors in the image on the right show relatively high amplifications (and damage) with the modeled wave values. Primofiore et al., 2020.
In the city of Kahramanmaraş (Turkey), certain areas of the city had most of the collapsed buildings during the earthquake of February 6, 2023. The area where most of the collapses occurred is an ancient alluvial drain for the drainage of water and sediment from the upper parts of Mount Ahir (Figure 3). The sedimentary architecture of the alluvial fans would be sufficiently different from the surrounding areas to consider that this observation may have been a key factor contributing to the comparatively greater destruction of buildings (see examples of alluvial fan architecture here).
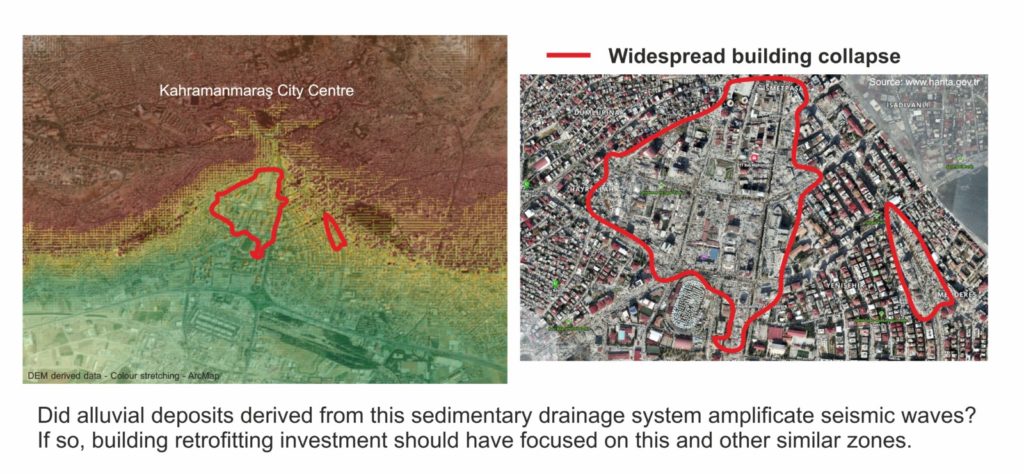
The image on the left shows a satellite view of the central part of the city of Kahramanmaraş with a stretched color overlay rendered from a digital elevation model (DEM). The DEM clearly shows that the city center is situated at the mouth of a drainage system from Mount Ahir. The image on the right shows a recent satellite view of the city center where most of the buildings collapsed.
The image on the left shows a satellite view of the central part of the city of Kahramanmaraş with a stretched color overlay rendered from a digital elevation model (DEM). The DEM clearly shows that the city center is situated at the mouth of a drainage system from Mount Ahir. The image on the right shows a recent satellite view of the city center where most of the buildings collapsed.
Adapting buildings to seismic hazards is costly, but, as shown by the earthquakes of 2016 in Italy, governments could use expert models to focus investments in certain areas of cities and towns where adaptation would be a priority due to comparatively high risk.
Help earthquake victims here: www.ifrc.org
References:
Celebi, M., 1991. Topographic and geological amplification: case studies and implications for engineering. Structural Safety, 10(1-3), pp.199-217.
Primofiore, I., Baron, J., Klin, P., Laurenzano, G., Muraro, C., Capotorti, F., Amanti, M. and Vessia, G., 2020. 3D numerical modeling to interpret topographic effects on rocky hills for seismic microzonation: the case study of the Arquata del Tronto neighborhood. Engineering Geology, 279, p.105868.
Semblat, J.F., Kham, M., Parara, E., Bard, P.Y., Pitilakis, K., Makra, K. and Raptakis, D., 2005. Amplification of seismic waves: basin geometry vs soil stratification. Soil dynamics and earthquake engineering, 25(7-10), pp.529-538.
Semblat, J.F., 2011. Modeling the propagation and amplification of seismic waves in linear and non-linear one-dimensional, two-dimensional and three-dimensional media. International Journal of Geomechanics, 11(6), pp.440-448.